HPLC Purity Testing Explained: What “99%+ Purity” Actually Means in Peptide Research
HPLC Purity Testing Explained: What “99%+ Purity” Actually Means in Peptide Research
“99%+ purity” appears on nearly every research peptide product page, but the number alone doesn’t tell you much without understanding how it was generated. High-performance liquid chromatography (HPLC) is the method behind that figure, and knowing how it works makes it much easier to evaluate whether a purity claim is credible — and what it actually implies about the other 1%.
What HPLC Measures
HPLC separates the components of a sample based on how they interact with a stationary phase (the column) versus a mobile phase (the solvent moving through it). As a sample is pushed through the column under high pressure, different molecules travel through at different speeds depending on their size, polarity, and chemical structure. Each component exits (“elutes”) at a different time and is detected — usually by UV absorbance — producing a chromatogram: a graph of detector signal over time.
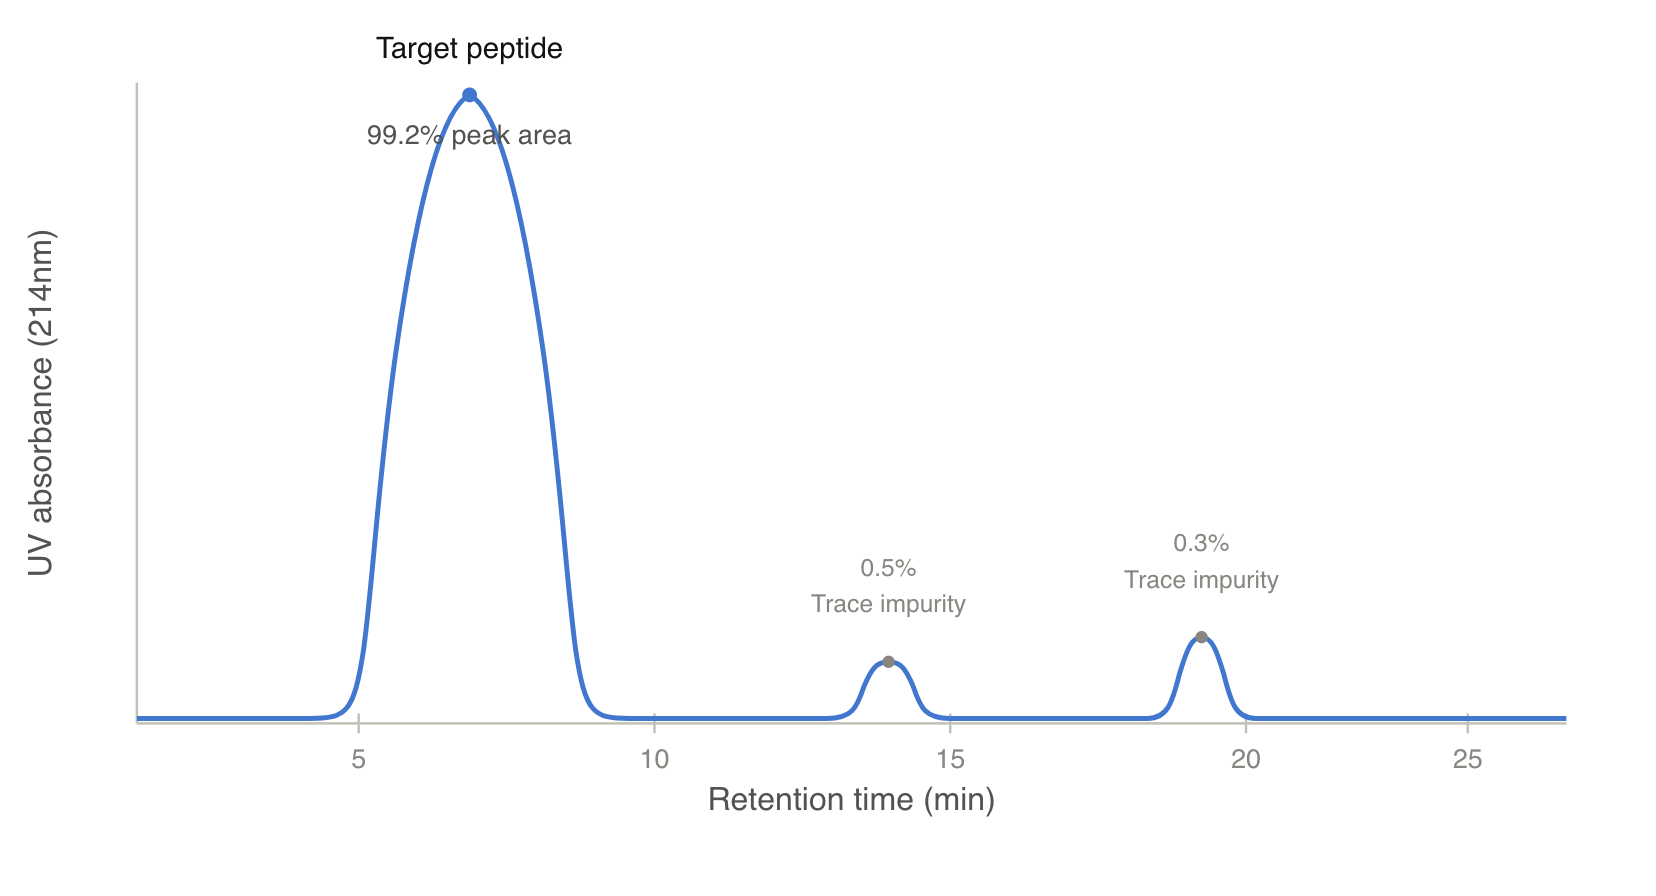
For peptides, each distinct molecular species in the sample — the target peptide, plus any impurities, degradation products, or synthesis byproducts — should, in principle, produce its own peak. The area under each peak is proportional to how much of that species is present.
From Chromatogram to Percentage
Purity by HPLC is calculated by comparing the area of the target compound’s peak to the total area of all peaks in the chromatogram:
Purity % = (Area of target peak ÷ Total area of all peaks) × 100
A “99%+ purity” claim means the target peptide’s peak accounts for 99% or more of total detected peak area, with the remaining ~1% distributed across minor impurity peaks.
This is why the chromatogram itself matters more than the number in isolation. A clean chromatogram shows one dominant, sharp peak with minimal shoulder or secondary peaks. A chromatogram with several smaller peaks scattered around the main one — even if they sum to only 1-2% — can indicate specific synthesis byproducts worth knowing about, particularly for compounds sensitive to trace contaminants.
Why Solid-Phase Synthesis Produces Impurities in the First Place
Most research peptides are made via solid-phase peptide synthesis (SPPS), where amino acids are added one at a time to a growing chain anchored to a resin. Each coupling step has a success rate — even at 99% efficiency per step, a 30-residue peptide multiplies that inefficiency across 30 sequential steps, so incomplete reactions, deletion sequences (where one amino acid fails to couple), and side-chain reactions are a structural reality of the synthesis process, not a sign of poor manufacturing on their own.
What separates rigorous manufacturing from low-quality production is what happens after synthesis: purification. Reverse-phase HPLC purification (a preparative-scale version of the same technique used for testing) is used to isolate the target peptide from these byproducts before the final product is packaged. The purity data on a COA reflects how effective that purification process was — it’s a quality control checkpoint on the finished product, not a measurement of synthesis efficiency itself.
Detection Wavelength and Why It’s Reported
Peptide HPLC is typically run with UV detection at 214nm, which corresponds to the absorbance of the peptide bond itself, making it a reliable, compound-agnostic detection method across different peptide sequences. Some labs additionally test at 254nm or 280nm depending on whether the peptide contains aromatic residues (like tryptophan or tyrosine) that absorb more strongly at those wavelengths. A COA that specifies the detection wavelength used is giving you enough information to judge whether the method was appropriate for the specific compound being tested.
What HPLC Purity Does Not Tell You
It’s worth being clear about the limits of this method. HPLC purity confirms how much of the sample matches the retention time of the target peak — it does not, by itself, confirm molecular identity. A contaminant with a very similar retention time to the target peptide could theoretically co-elute and be counted as part of the “pure” peak. This is why a complete COA pairs HPLC purity data with mass spectrometry identity confirmation (covered in our companion article on reading a full COA) — the two methods check different things, and together they give a much more reliable picture than either alone.
Practical Takeaways for Evaluating a Supplier’s Purity Claims
- Ask for the actual chromatogram, not just the stated percentage
- Check that the detection wavelength is specified
- Confirm HPLC data is paired with mass spec identity confirmation
- Look for batch-specific data rather than a generic purity claim applied across an entire product line
- Be cautious of purity figures with no supporting documentation at all — a number without a chromatogram is a claim, not data
Purity testing is one piece of a larger quality picture, but it’s often the most misunderstood. Knowing how the number is generated makes it much easier to tell the difference between a rigorously tested batch and a marketing figure.
This article is intended for informational and educational purposes for laboratory research professionals. Zymera Labs compounds are sold for research and educational use only, not for human or veterinary consumption.